Options are said to be one of the riskiest investment instruments there are. The truth is, that if you don’t know what you are doing they are the riskiest thing you could do with your money. In the many Facebook groups that I belong to, there are always posts from people that are posting their trades, that appear to have no clue as to what kind of risk they are getting themselves into.
This is technically an article about the Greeks, because the 3 risks in options trading are also the 3 ways to profit from options. To be a successful trader you need to have a solid understanding of all aspects of risk. Once you know where your risk is at then you can place positions that will exploit the risks to profit.
With stock you basically have one risk, price. If you buy a stock the price going down is your only risk. Because options derive their price from another asset, you have underlying risk or Delta and Gamma risk. Because options expire you have time or Theta risk. And because options are trad able assets you have implied volatility or Vega risk.
Underlying Price Risks (Delta and Gamma)
Underlying risk in most cases the most dangerous risk. The Greeks Delta and Gamma measure this risk. Delta measures how much the price of an option will change with a $1 move in the underlying. Gamma measures how much the Delta will move with a $1 price move in the underlying.
Below is an option chain for SPY, 13 days til expiration, with Delta and Gamma listed on the chain. The at the money call, 322.5, has a price to buy of $3.03, a Delta of .50 and a Gamma .05. Theoretically speaking and all things being equal, if the price of SPY increases by $1, the price of that option will increase to $3.53, and the Delta will increase to .55. If SPY moves up $1 more, then the value of the option will be $4.08.
Conversely, if the price of SPY drops $1 the price of the option will move from $3.03 to $2.53, and the Delta will go from .50 to .45. If SPY falls another $1 after that, then the price of the option will be $2.08. A $2 move in the stock would cause a roughly 30% change in value for an the at the money option. These price changes are theoretical and do not take into account changes in time to expiration and implied volatility.
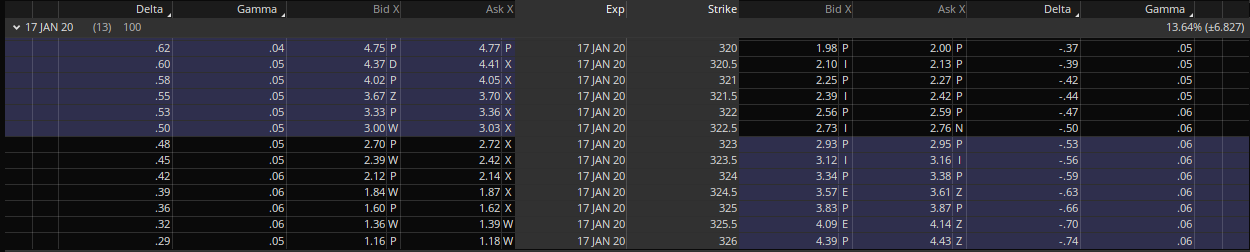
Lets take a look at the put side, or the right side. The Delta for puts are always negative, that just means that buying puts makes money when prices decline. If you buy the at the money put 322.5, it will cost $2.76, it has a Delta -.50 and a Gamma .06. So a $1 move down in the stock, would result in the option price to move to $3.26 and the Delta would then move to -.56. Another $1 move down would change the option price to $3.82. That is a $1.06 change a greater than 30% move.
What happens if you buy a put and the stock goes up $2? The price of the option would fall to $1.82. A .94 loss would be incurred. Notice that if the stock goes in your direction, you would theoretically gain $1.06, and if the stock goes opposite of your direction, the same amount you would only lose .94. That is the effect of Gamma. That is roughly a 10% difference. One would think that that might give you an edge to buy options, but once we factor in Theta and Vega, you will see that buying options does not give a significant edge.
Notice the 320 call has a Delta of .62 and the 326 call has a Delta of .29. Also notice that the 326 put has a Delta -.74 and the 320 put has a Delta of -.37. That is the nature of Delta that the further the in the money options have a greater Delta. Below is a graph of the call Delta options for the above option chain.
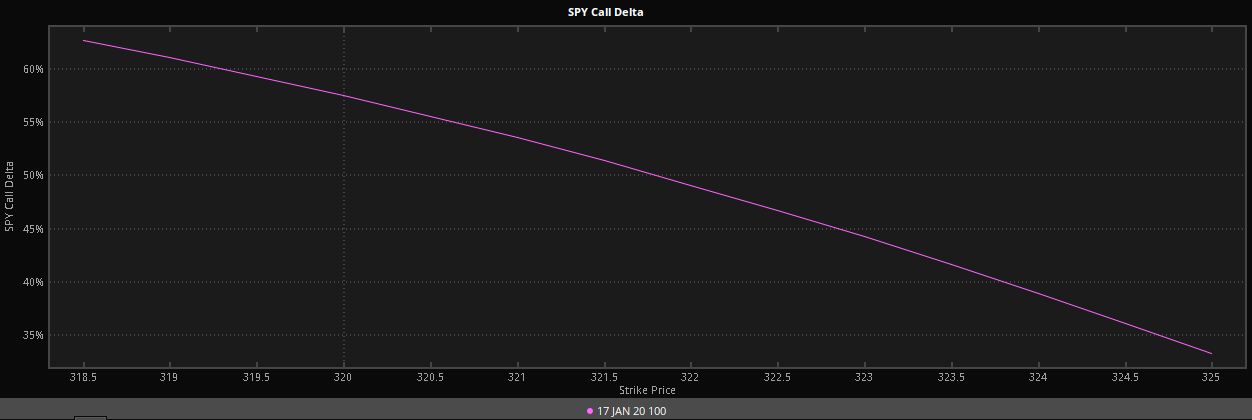
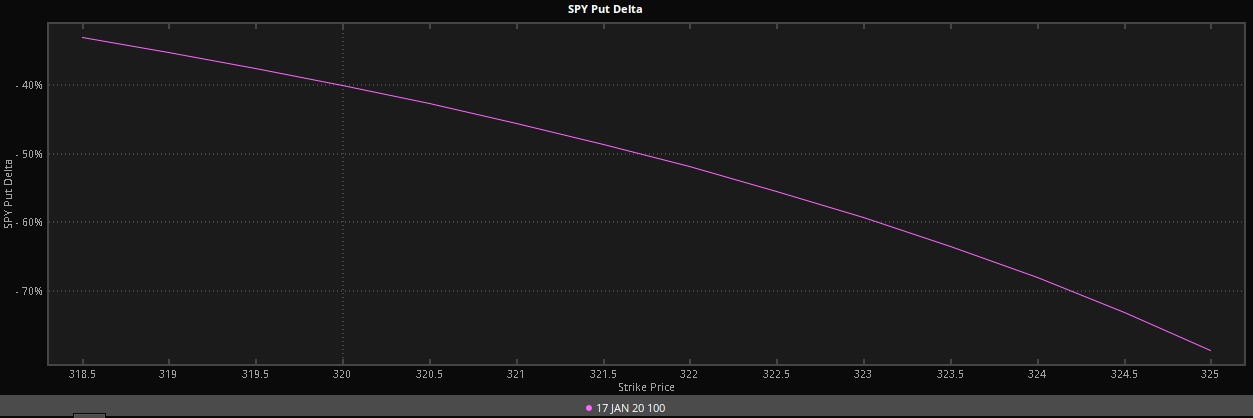
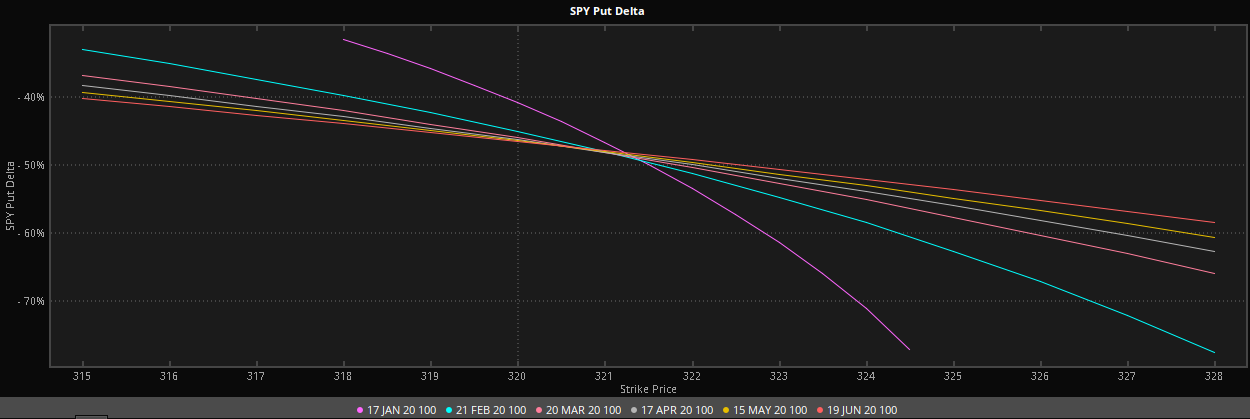
Below is a graph for the put side. Just to reiterate the point that the more in the money an option is the greater the Delta. Notice the negative numbers on the left side for the put Deltas.
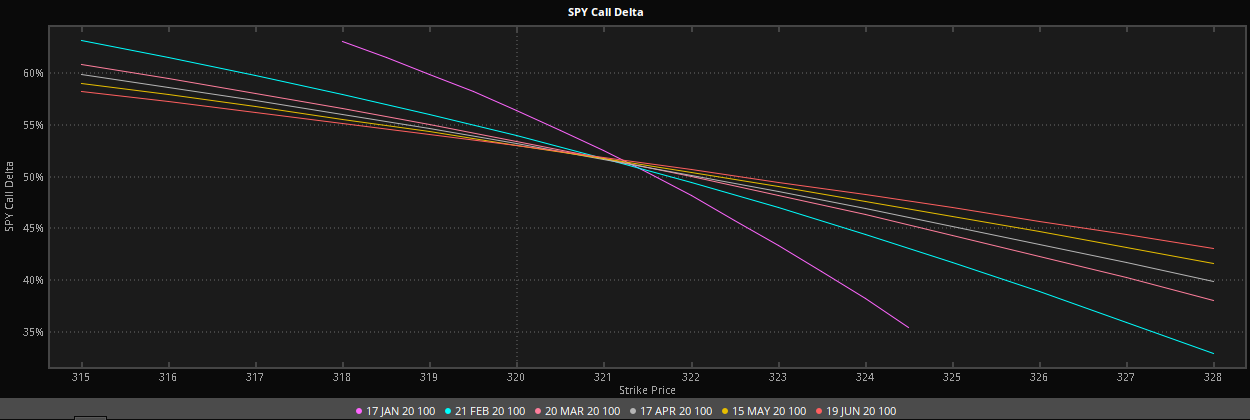
On the multiple expiration Delta graphs below, notice the closer the options get to expiration the steeper the Delta curve is. Meaning that the closer to expiration, the further In the Money options have a higher Deltas, while the out of the money options have lower Delta’s.
Notice on the put graph below that delta is a negative number.
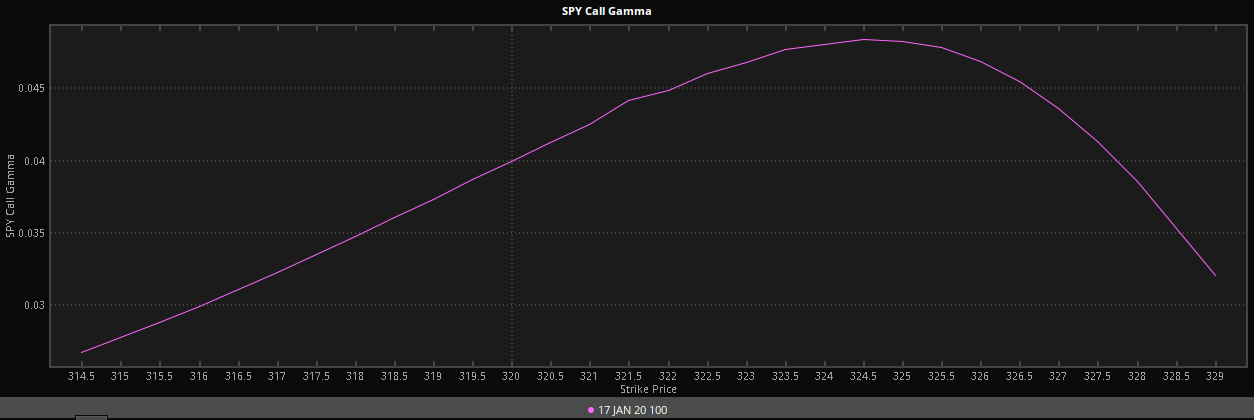
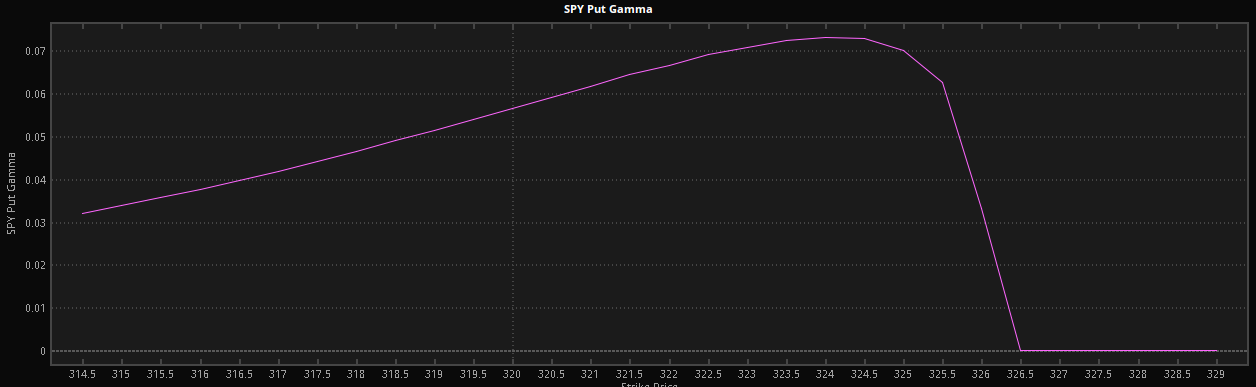
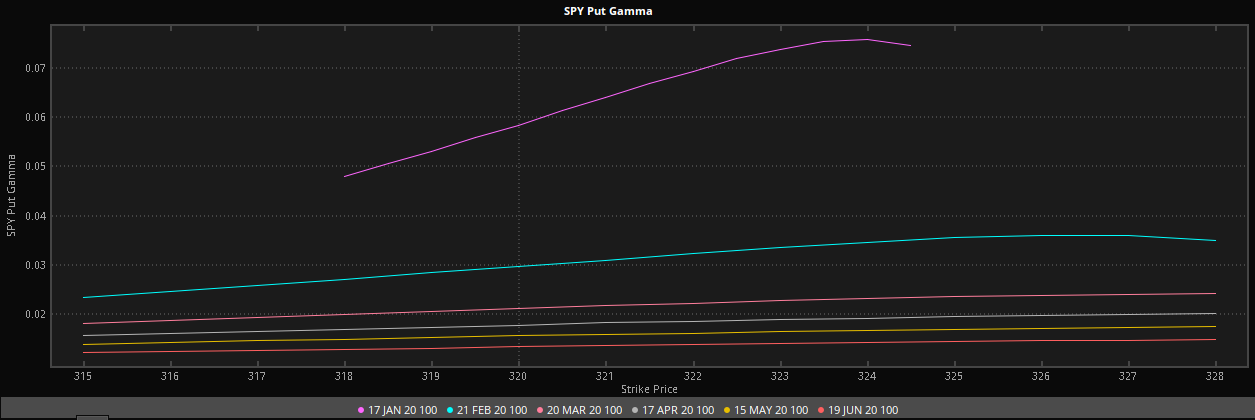
Gamma is highest at the money.
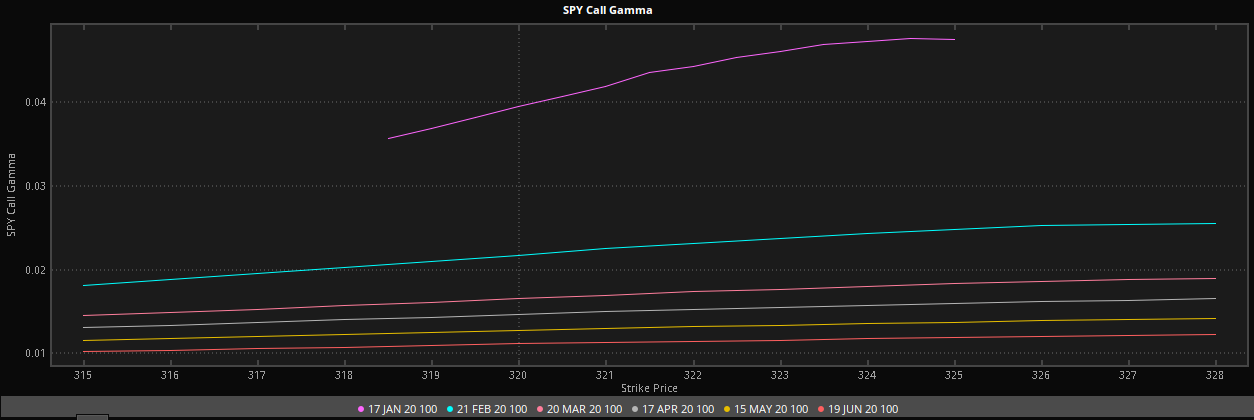
Notice that Gamma is greater the closer to expiration. On the put and call side.
Delta and Gamma are really a measure of your leverage. They will tell you how much you will make or lose compared to the underlying. Of course these numbers are theoretical do not take into account the other Greeks. A lot of traders will only look at Delta and will ignore the other Greeks. This is a huge mistake.
Time Decay Risk (Theta)
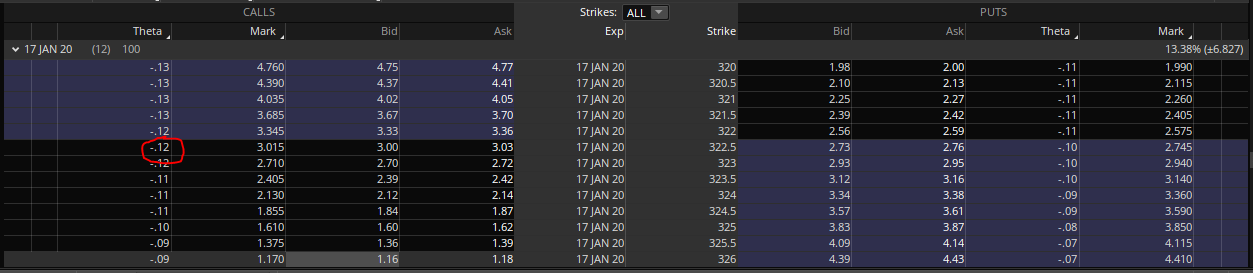
Theta is a measure of how much an options value will decline with the passage of a day. On the option chain below notice that the Theta of the 322.5 call option is negative -.12. That means that everyday that passes, the value of this option will decline by $12. If the price of SPY stays the same until the next day, the price of this option will theoretically drop to $2.91.
Let suppose that SPY moves up $1 tomorrow. Add the .50 Delta then minus the -.12 Theta, will give you a price of $3.41. Lets suppose you buy that call anticipating the price of SPY will go up, but the price drops $2. After calculating the Delta and Gamma the option’s price will be $2.08 then minus the Theta will be $1.96.
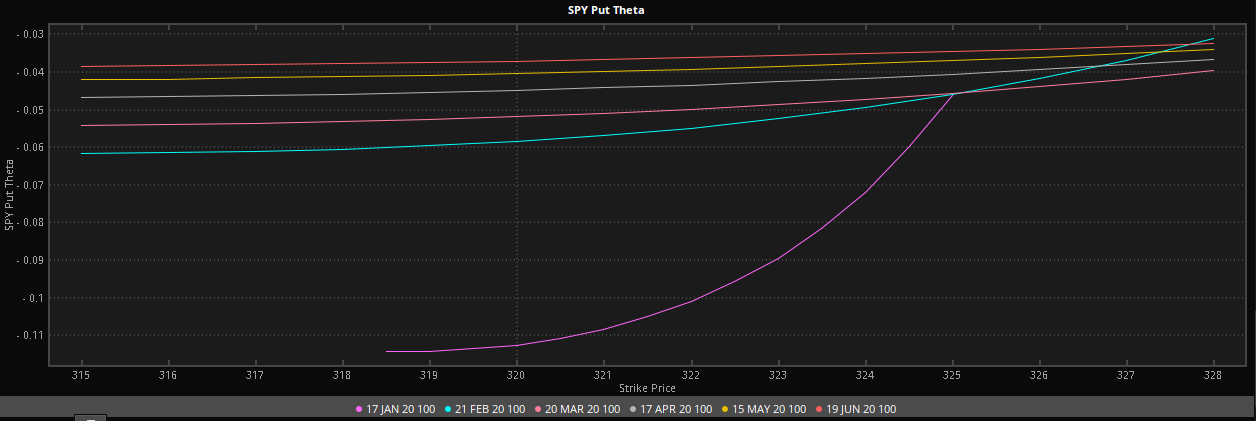
The 2 charts below, graph the current Theta numbers for the calls and the puts. Notice the closer an option gets to expiration the larger the Theta decay will be. The options that are closest to expiration can have a higher dispersion of Theta numbers between the strike prices. While the further out options have a more uniform Theta numbers between strikes.

Theta risk can be huge if you have long options, Theta will always be against you. In the above example you would lose $12 a day and as expiration nears that number will increase. If you have short option positions then Theta will always be on your side.
Volatility Risk (Vega)
Vega measures how much an option price will change with a 1% change in Implied Volatility. If you are not familiar with Implied Volatility you should read this article, What is Implied Volatility? It is an in depth discussion about Implied Volatility and will give you a very good understanding of this concept.
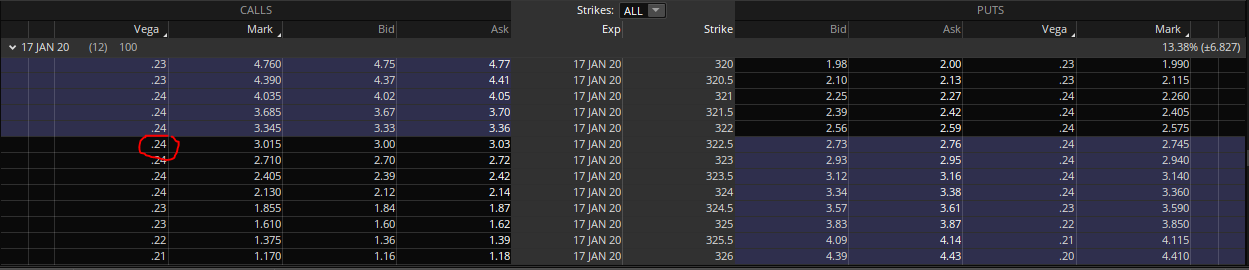
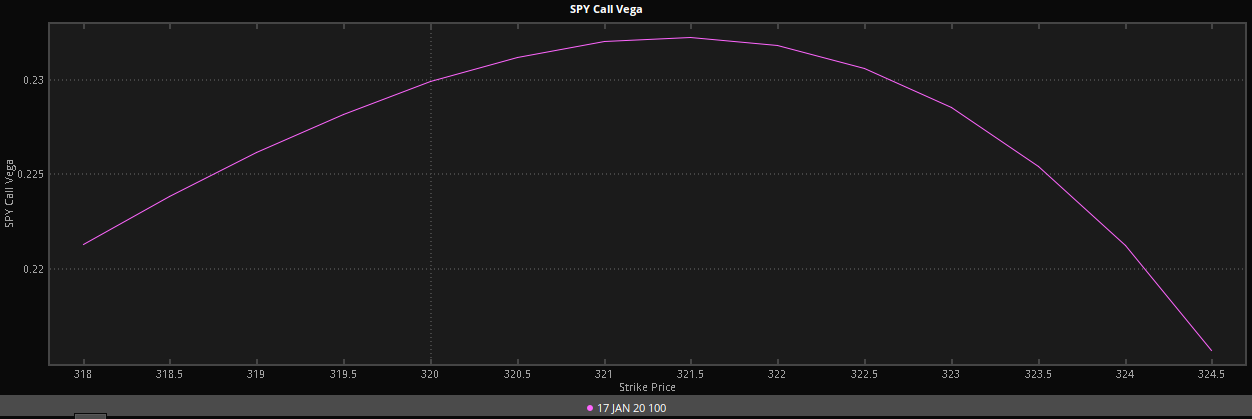
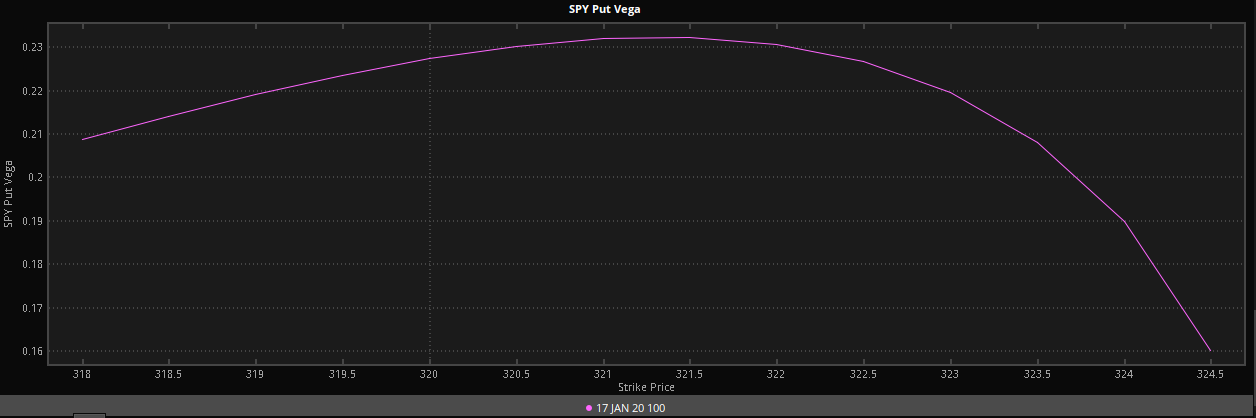
Below is the same Option chain as the above two examples, but this time with Vega listed. The same option, the 322.5, that we have using as an example has a Vega of .24. That means that with a 1% change in implied volatility the value of the option will change $24.
In the above examples a $1 move up in SPY, after calculating Delta, Gamma, and Theta the value of the option will be $2.41. But we will also need to calculate Vega. If you read the What is Implied Volatility? article, you know that a price move up usually causes implied volatility to decline. So a $1 move in the stock could cause a .25% drop in implied volatility. That would cause a $6 decline in the value of the option. So after calculating all of the Greeks, the price a $1 move in the stock in a 1 day period would result in the option’s value of $3.35.
On the graphs below, you can see that Vega is highest at the money, in the puts and the calls.
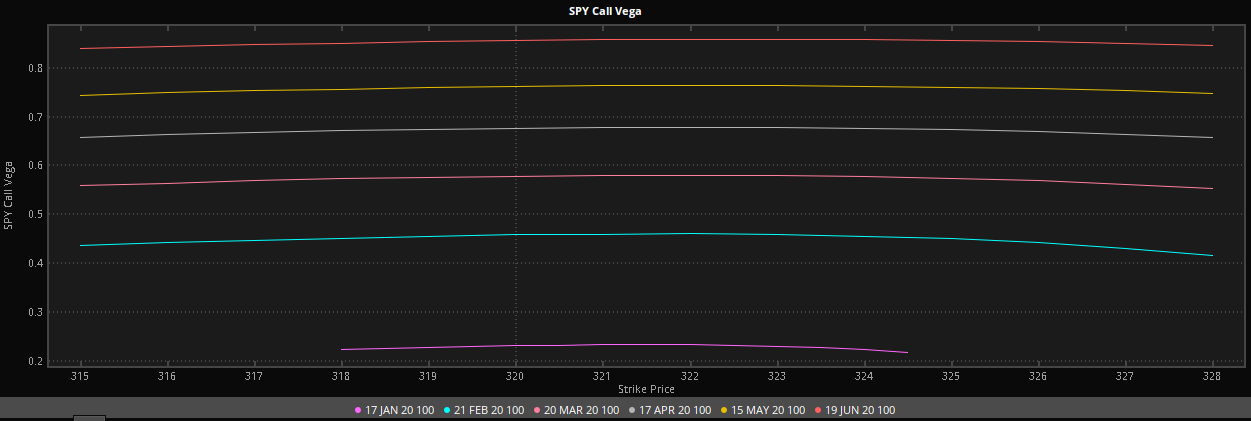
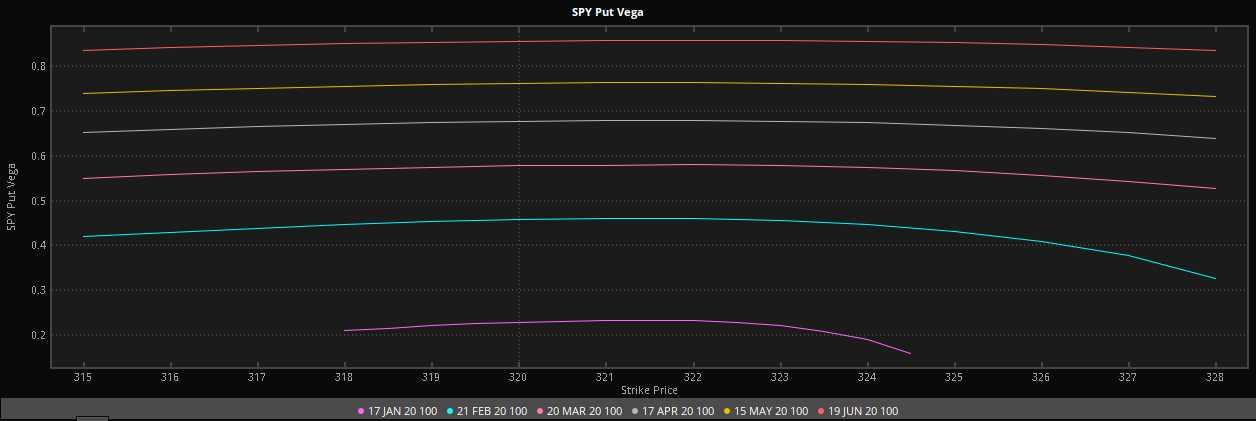
Vega is also higher the longer the time until expiration
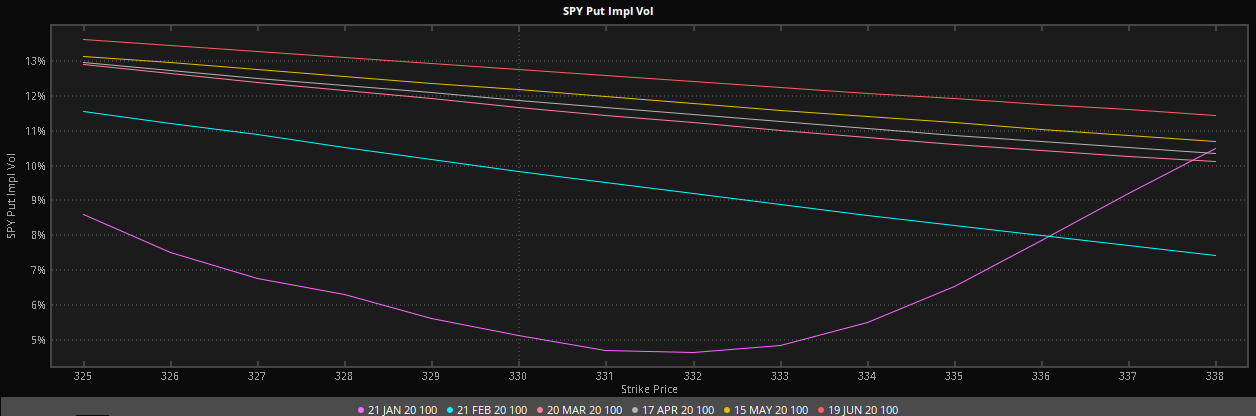
Below is a graph of Implied Volatility for multiple expiration. Implied Volatility is usually highest the further the time until expiration. And it is higher for the lower strike options. This is not always the case.

Now that we have an understanding of what the Greeks are, let put this in to practice.
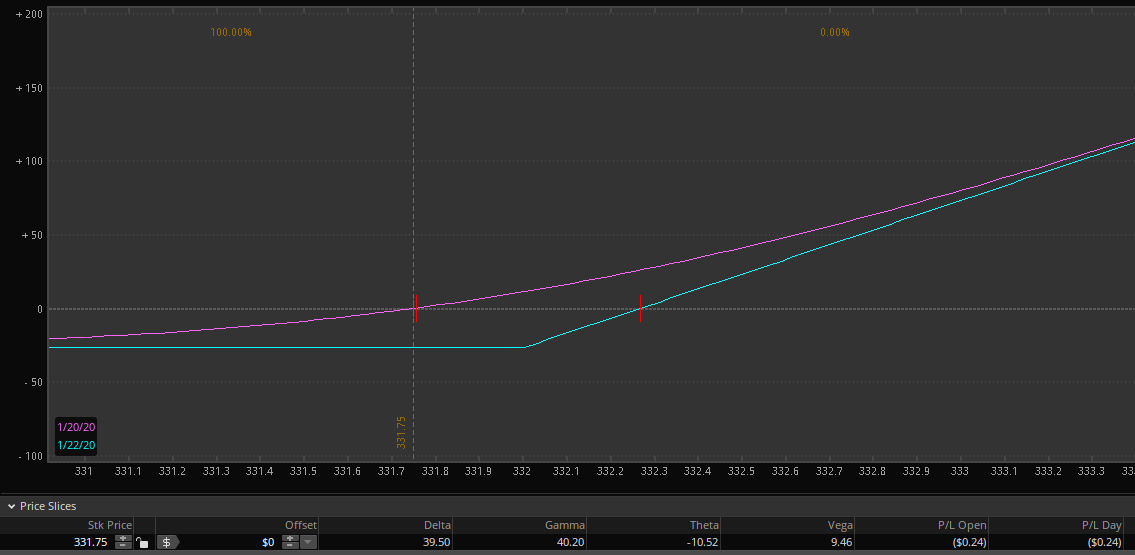
Below are 3 different risk to reward graphs for long, at the money call options in the SPY. The First is 1 day til expiration, the second is 30 days til expiration, and the third is 60 days til expiration.
At the bottom of each picture you will find the Greeks that correspond with each position. Let’s start by comparing the Delta.
1 Day Delta at 39.50 is 10 points less than the further out expiration’s, that are pretty much identical at 49.
The Gamma for the 1 day is 40, while the 30 and 60 day Gamma is 10 and 20 times lower at 4 and 2 respectively. What does this tell us? The value of this option could move drastically.
Theta of the 1 day is -10, for the 30 day is -6, and for the 60 day is -5. There is not to big of a difference between the further out options, but this difference will begin to widen as the 30 day gets closer to expiration, as we can see the 1 day has double the Theta as the 60 day.
The Vega for the 1 day is at 9, but look how the Vega expands with the more time til expiration. The 30 day has a Vega of 37 and the 60 day has a Vega of 53.


So what does all of this mean? Starting with price risk, the Delta of the 1 day til expiration option is 10 deltas lower than the longer term options, pair that with the Theta that is at -10 which seems like this would be an ideal option to sell, and a quick way to make $30. But when we look at the Gamma being 40, this options value can move. Lets suppose you sell this option for the $.29. What if SPY moves against you by two dollars? You will be in the whole by $170.
What if you expect SPY to have a huge day which option would you choose? Let’s suppose a $2 price would take place which would be the best option to buy to give us the most bang for our buck.
The 1 day til expiration value at the end of the day would mean that there would be no extrinsic value. So you buy 332 option for $30 while the stock is trading at 331.75. So the SPY closes at 333.75. You have $175 of intrinsic value, minus the $30 you paid, gives you a profit of $145.
The 30 days til expiration option is trading for $360. The 1st one dollar move would bring it’s value up to $409. The second would bring it up to $462. Minus the Theta of 6, $456. We also must take into account the possible loss of Vega due to implied volatility drop. A $2 move up could drop implied volatility .25%. That would equate to $9 drop in the option’s value. Bringing the value to $447. That would be an $87 gain.
The 60 day option costs $648. After Delta and Gamma would be $750. Minus Theta $745. Minus Vega brings the Value to $732. This option would yield a roughly $84 gain.
So which option would be the best? This is a no-brainer. The 1 day option is by far the best.
But what if we are wrong in our price assumption and the price of SPY goes down $2?
The 1 day option loss would be the price you pay for the option $30.
The 30 day option’s value after Delta, Gamma, Theta, and Vega would be roughly $270. That’s a $90 loss.
The 60 day would be worth $559. That is an $89 loss.
So even in this scenario, the 1 day til expiration destroys the other 2 options. If you are right, you 5x your money. If you are wrong you only lose a 3rd of what the other 2 expirations lose.
Let’s look back and see if this actually works. On 1/10/2020 SPY closed at 325.71. The next day SPY rallied and closed at 327.95. We are going to take look back to see which at the money option would be the best way to have played this move.
Below are the 3 options we will look at. The short term option say it has 3 days til expiration, but the 10th was on a Friday, and this option expired on the following Monday.
Screen shots from 1/10


Screen shots from 1/13


The Jan 13 option’s value went from $52 to $203. $151 gain. 300% profit.
The Feb 10 option went from $392 to $522. $130 gain. 33% profit.
The March 20 option went $715 to $849. $134 gain. 18% profit.
As you can see this works out just the way the Greeks predicted it would. I am not saying that you should buy 1 day til expiration options, but if you are expecting a quick move in the underlying, this is definitely the way to play it.